HOW TO – Analyze Data with DataStudio
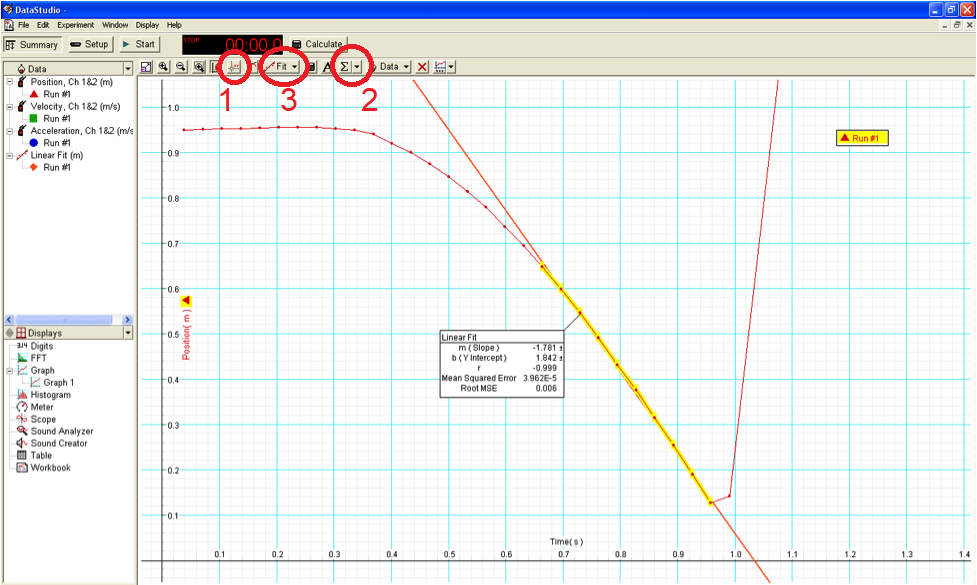
DataStudio is used to collect data from sensors connected to ScienceWorkshop interfaces. The raw data can be viewed in a “Table” display, accessible via the sidebar on the lower left of the program window. When data is displayed in a graph window, there are various ways it can be analyzed.
- Individual data points can be selected and displayed using the “Smart Tool”.
- Statistics such as mean, standard deviation, minimum, and maximum value can be displayed using the statistics button. Statistics for a subset of data points can be shown by dragging a box with the mouse.
- Various model functions (linear, quadratic, etc.) can be fitted to the data using the “Fit” button. Again, a subset of the data can be fitted by drag-selecting with the mouse.
