Plotting Spherical Harmonics in 3D
Objectives
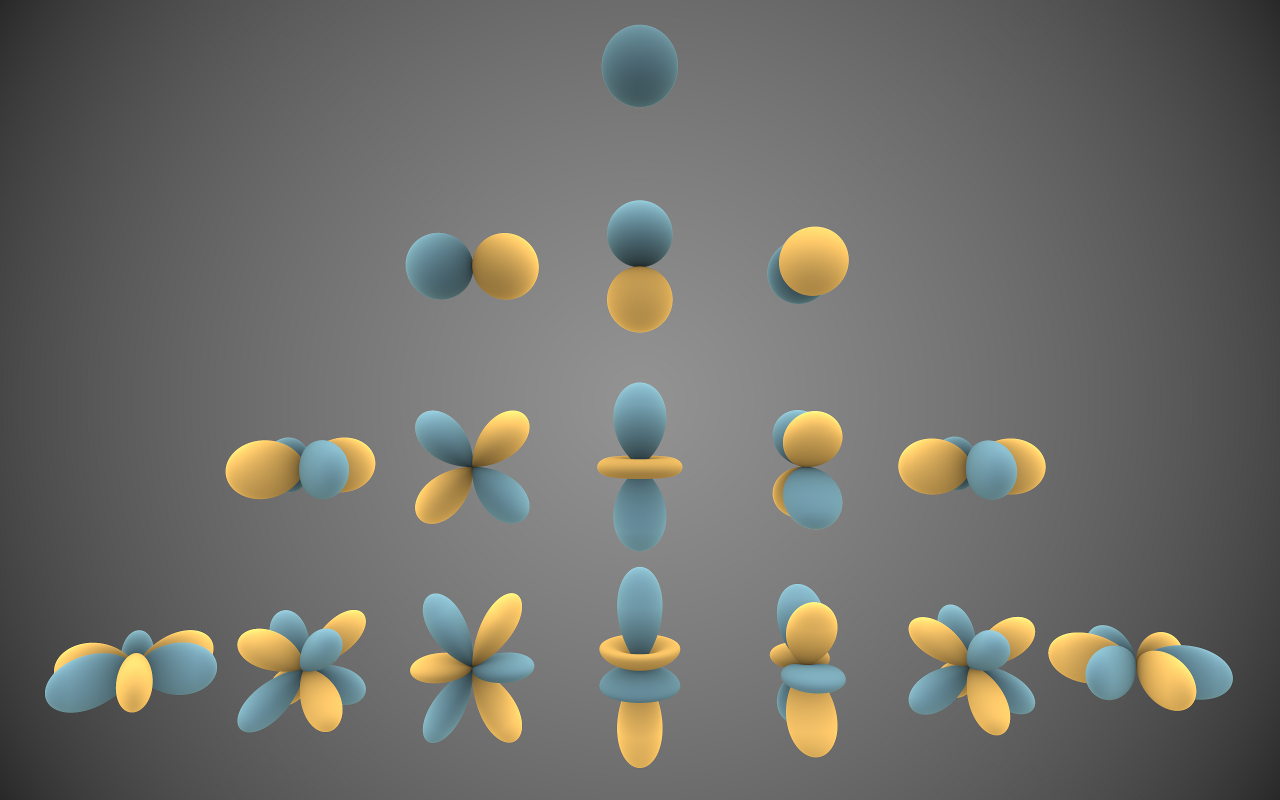
- Plot spherical harmonics Y_\ell^m(\theta, \phi) in 3D using Python
- Modify the code to plot spherical harmonics for various values of \ell, m
- Compare plotted harmonics to expected shapes
Resources
- Computer with Python and IPython installed
- required libraries: scipy, matplotlib
- Table of Spherical Harmonics
Background
 The spherical harmonics are special mathematical functions that form a complete set of orthogonal functions on the surface of a sphere. Thus, any function on the surface of a sphere can be defined as a sum of spherical harmonics. This is similar to the way sines and cosines can be combined in a Fourier series to represent any periodic function of one variable. Spherical harmonics are important in many theoretical and practical applications, including modeling of electrostatic and electromagnetic fields, computation of atomic electron orbital configurations, 3D computer graphics, and many, many more.
There are different ways to define the spherical harmonics depending on the coordinate system chosen. A common form is the Laplace spherical harmonics defined in spherical coordinates Y_\ell^m(\theta, \phi), where \theta is the polar angle and \phi is the azimuthal angle. The integers \ell, m correspond to different solutions of Laplace’s equation. For an electron bound to an atomic nucleus they represent the magnitude and z-component of the electron’s orbital angular momentum.
Method
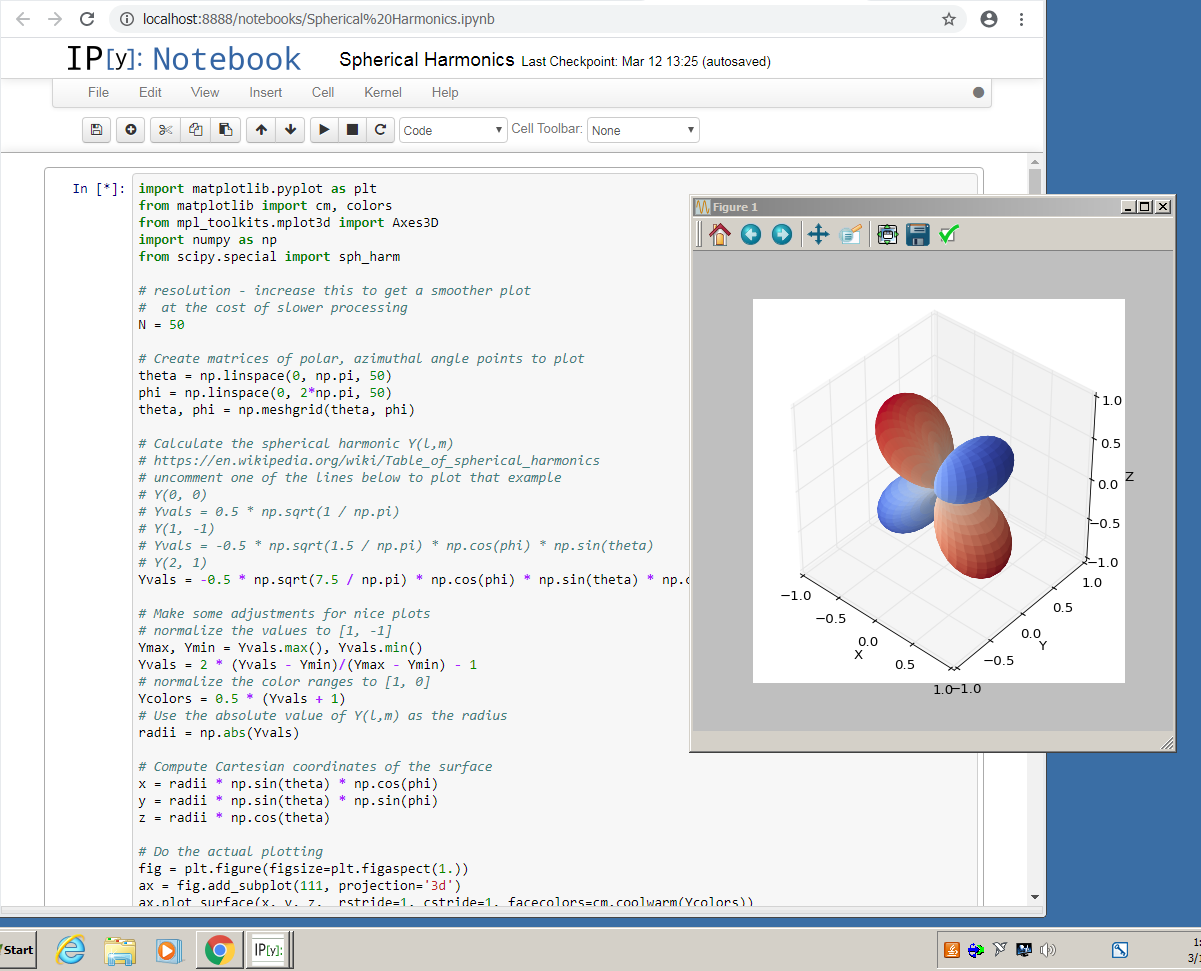 Start up the IPython Notebook on your computer. This can be found most easily by typing the first part of the name in the Start menu. This will open a web page interface that allows you to easily create, run , and debug Python code.
Create a new notebook. Click on the notebook name “Untitled” and rename it to something descriptive, such as “Spherical Harmonics”. Copy and paste the code below into the notebook, and click the Run button (the small right-pointing arrow). In a few minutes, your plot should appear. You can rotate the plot in three dimensions by dragging with the mouse. Note: the plot sometimes appears behind the web page, so you will need to drag the web page out of the way to see it.
Show/Hide code
import matplotlib.pyplot as plt
from matplotlib import cm, colors
from mpl_toolkits.mplot3d import Axes3D
import numpy as np
from scipy.special import sph_harm

# resolution - increase this to get a smoother plot
#  at the cost of slower processing
N = 50

# Create matrices of polar, azimuthal angle points to plot
theta = np.linspace(0, np.pi, N)
phi = np.linspace(0, 2*np.pi, N)
theta, phi = np.meshgrid(theta, phi)

# Calculate the spherical harmonic Y(l,m)
# https://en.wikipedia.org/wiki/Table_of_spherical_harmonics
# uncomment one of the lines below to plot that example
# Y(0, 0)
# Yvals = 0.5 * np.sqrt(1 / np.pi) * np.ones(theta.shape)
# Y(1, 1)
# Yvals = -0.5 * np.sqrt(1.5 / np.pi) * np.cos(phi) * np.sin(theta)
# Y(2, 2)
Yvals = 0.25 * np.sqrt(7.5 / np.pi) * np.cos(2 * phi) * np.sin(theta)**2

# Make some adjustments for nice plots
Ymax, Ymin = Yvals.max(), Yvals.min()
if (Ymax != Ymin):
# normalize the values to [1, -1]
    Yvals = 2 * (Yvals - Ymin)/(Ymax - Ymin) - 1
# Use the absolute value of Y(l,m) as the radius
    radii = np.abs(Yvals)
# put the colors in the range [1, 0]
    Ycolors = 0.5 * (Yvals + 1)
else:
# can't normalize b/c Y(0,0) is single-valued
    radii = np.ones(Yvals.shape)
    Ycolors = np.ones(Yvals.shape)

# Compute Cartesian coordinates of the surface
x = radii * np.sin(theta) * np.cos(phi)
y = radii * np.sin(theta) * np.sin(phi)
z = radii * np.cos(theta)

# Do the actual plotting
# negative values will be blue, positive red
fig = plt.figure(figsize=plt.figaspect(1.))
ax = fig.add_subplot(111, projection='3d')
ax.plot_surface(x, y, z,  rstride=1, cstride=1, facecolors=cm.coolwarm(Ycolors))
ax.set_xlabel('X')
ax.set_ylabel('Y')
ax.set_zlabel('Z')
ax.set_xlim(-1,1)
ax.set_ylim(-1,1)
ax.set_zlim(-1,1)
plt.show()
Analysis Questions
- Modify the code to produce plots for Y_2^0(\theta,\phi), Y_3^2(\theta,\phi), and Y_5^{-3}(\theta,\phi).
- Which harmonic(s) are symmetric about the z-axis? Why?
- Which harmonic(s) are symmetric about all axes? Why is this the case?