Constant Force
Objectives
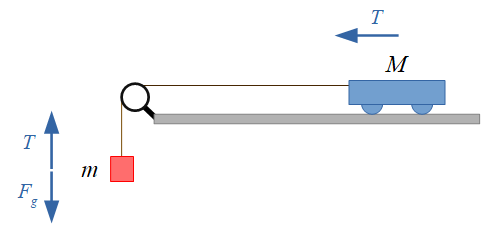
- Use force diagrams to apply Newton’s laws and correctly predict the acceleration of a cart of mass M on a flat track pulled by a hanging mass m
- Measure the cart’s acceleration with different added masses and hanging masses to test the prediction.
Resources
- Flat dynamics cart track
- Cart with force sensor attached
- Motion Sensor
- Science Workshop interface and DataStudio software
- Datastudio setup file: newtonslaw_motionsensor.ds
- Pulley and string
- Mass hanger and masses
- Heavy mass blocks for carts
Background
Newton’s second law can be used to predict the acceleration, and thus motion, of an object, but it must be applied properly. The law must be applied to each object individually, and all the force acting upon an object must be accounted for to calculate the net force.
Force diagrams are a useful tool for applying Newton’s second law correctly. In the diagram below showing the setup of this experiment, force diagrams have been drawn for the cart and for the hanging mass. Each set of arrows implies its own F_{net}=ma equation, showing the direction and type of force. The tension force T is the reaction force of each object pulling on the other through the string. In this situation, the magnitudes of the accelerations of the two objects are equal since they are connected via the string, making the two force equations simultaneously solvable.
Method
Draw force diagrams as shown above and write an F_{net}=ma for the cart and one for the hanging mass. Solve symbolically for the unknown acceleration a so that it can be predicted for varying cart masses and hanging masses.
Set up the experiment as shown in the image above. Release the cart and measure its acceleration and the applied force (tension) for a range of hanging masses and cart masses, and compare to your predictions.
